Debug Twig template
The Twig templating engine provides a debugging tool.
Drupal 8’s implementation also adds an extra tool that lets you locate the template that outputs markup.
Warning: Enabling Twig debugging may break some parts of the site, especially Views. See this issue.
Enable Debugging
You enable Twig debugging in sites/default/services.yml.
Set the debug variable to true and clear the cache:
parameters:
  twig.config:
debug: true- If
services.ymldoes not exist yet, copydefault.services.ymltoservices.yml. - If Drupal is already installed, you may need to temporarily change permissions on the
sites/defaultdirectory to allow write access. - How to change directory permissions
- After editing, revert permissions to secure the
sites/defaultdirectory.
Check Debugging
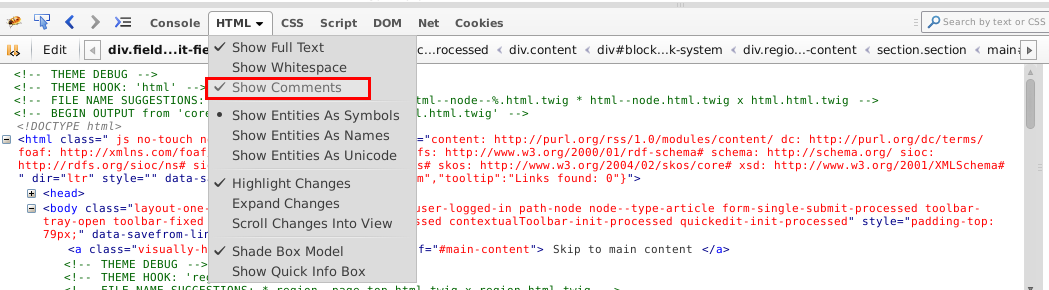
If using Firebug (Firefox), ensure “Show Comments” is enabled or view the page source directly:
Automatic Reload
Twig templates are compiled into PHP classes on disk for performance, meaning templates don’t update immediately by default. Do not enable this in production.
To manually rebuild templates, run drush cr. To save time during development, enable auto reload by setting twig.config.auto_reload: true in services.yml (it’s enabled by default when debug: true).
More details at https://drupal.org/node/1903374
View Variables
The best way to view variables is with Xdebug.
Using non-Xdebug methods below may lead to massive recursive render outputs not very useful.
The most recommended approach is PHPStorm with Xdebug—easiest to configure. Most IDEs have an Xdebug plugin. A free, lightweight option is VSCode with PHP and Xdebug plugins.
Setting up Xdebug
Xdebug setup can be tricky, so be sure to read your IDE’s plugin documentation and review Xdebug’s own documentation. Searching online won’t help if you target the wrong environment (e.g., Xdebug inside Vagrant, VirtualBox, Docker may require “remote” setup: https://xdebug.org/docs/remote).
Drupal.org has Xdebug guides for different editors: https://www.drupal.org/docs/develop/development-tools/xdebug-debugger
When using Xdebug:
Three ways to set breakpoints in Twig templates so your IDE can show variables:
{{ devel_breakpoint() }}- Using the Twig Xdebug module:
{{ breakpoint() }}If You Can’t Use Xdebug...
... read on and good luck, my friend.
{{ dump() }}
{{ dump(variable_name) }}
{{ dump(_context|keys) }}
To pretty print variables with Kint (requires composer require --dev drupal/devel 1.0-alpha1 and drush -y en kint):
{{ kint() }}If Kint crashes your browser on large render arrays, try:
Or use the Vardumper Twig module for Twig:
{{ vardumper() }}
{{ vardumper(variable_name) }}
... but also consider investing an hour into setting up Xdebug — it will make your life so much easier for inspecting variables.
If You’re Using the Wrong Paradigm...
If you're doing complex logic in Twig, consider whether it should be done elsewhere. For example, instead of complicated Twig logic, consider copying a formatter plugin into a custom module and tweaking the annotation and PHP/HTML logic. Plugins in Drupal 8 are just structured files in known folders and easy to work with.
Additional debugging tips: https://www.drupal.org/node/1903374