3.5.7. Data Aggregation in Views.
The Views module allows not only to output data from the Drupal tables, but it also knows how to calculate this row and group the results. This feature is called aggregation.
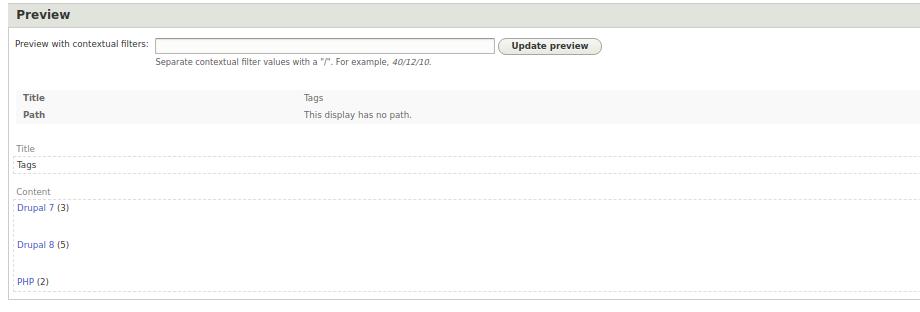
By default, Drupal has a Dictionary of Taxonomy Tags. Let's create a block with the most popular tags and display at the end of each tag how many materials on the site with this tag. We get something like this list:
Drupal 9 (5)
Drupal 8 (3)
PHP (2)
To get started, you will need to create Articles and bind tags to them.
/node/add/article
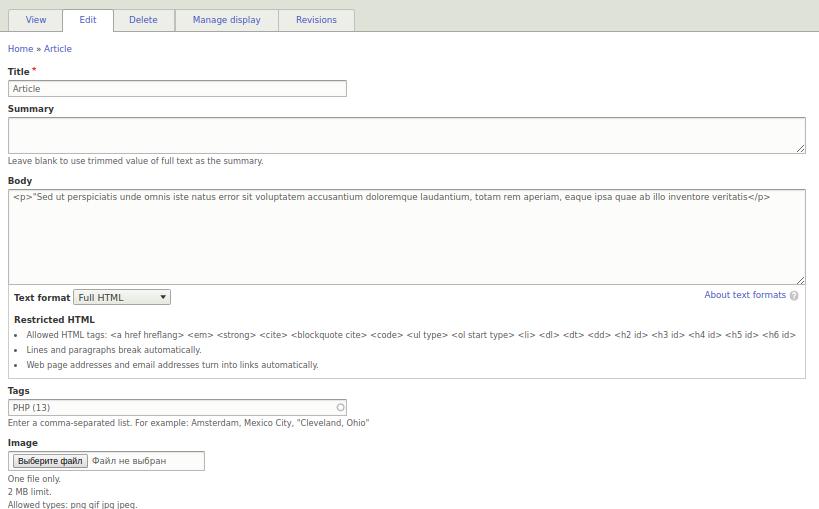
After creating a small number of articles, you can get down to business.
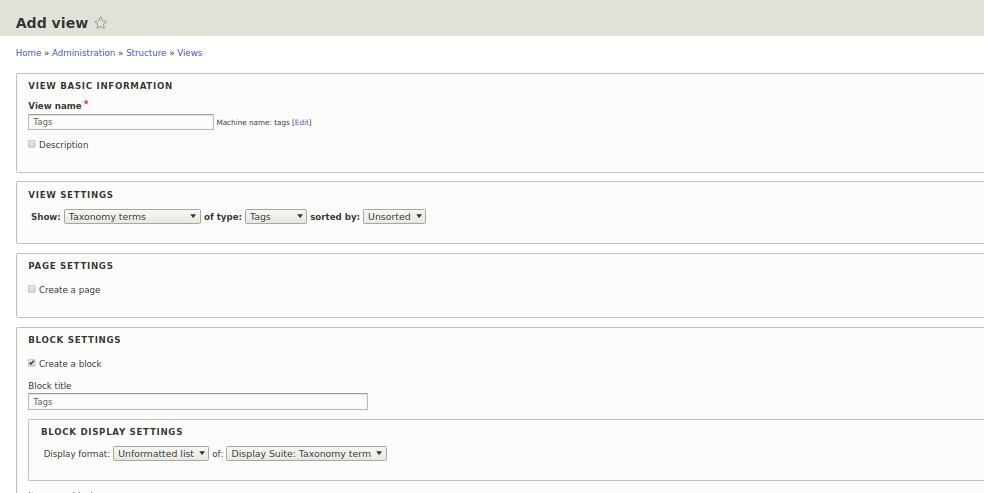
/admin/structure/views/add
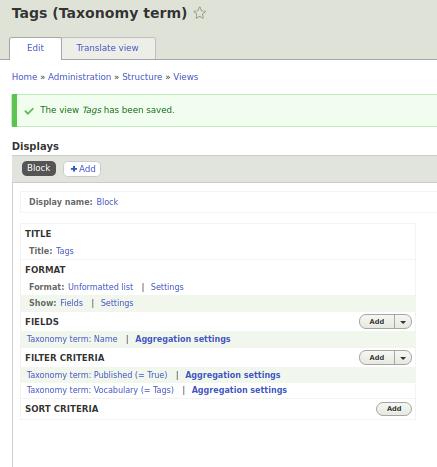
Add Views block, select Taxonomy and Tags:
Next, you need to enable aggregation in Views:
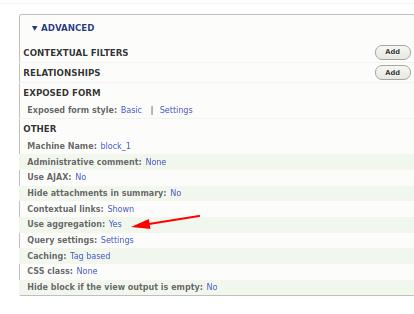
Now we have additional settings for aggregation in the fields:
Now add the RELATIONSHIPS Content with the term:
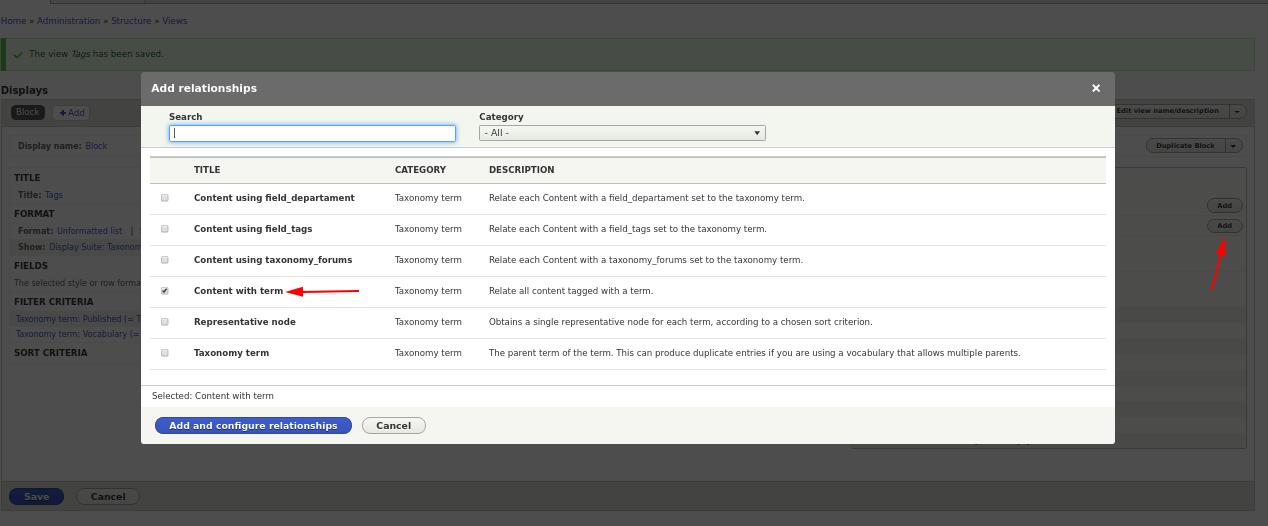
Select Require this rating to count only the content in which the tag is selected:

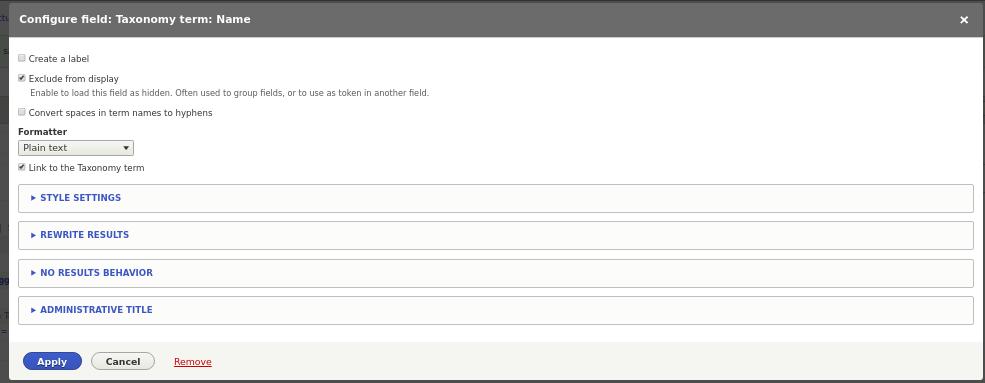
Now we need two fields of the Term Taxonomy (Name), we hide the first:
To the second field we set the type of aggregation Count:
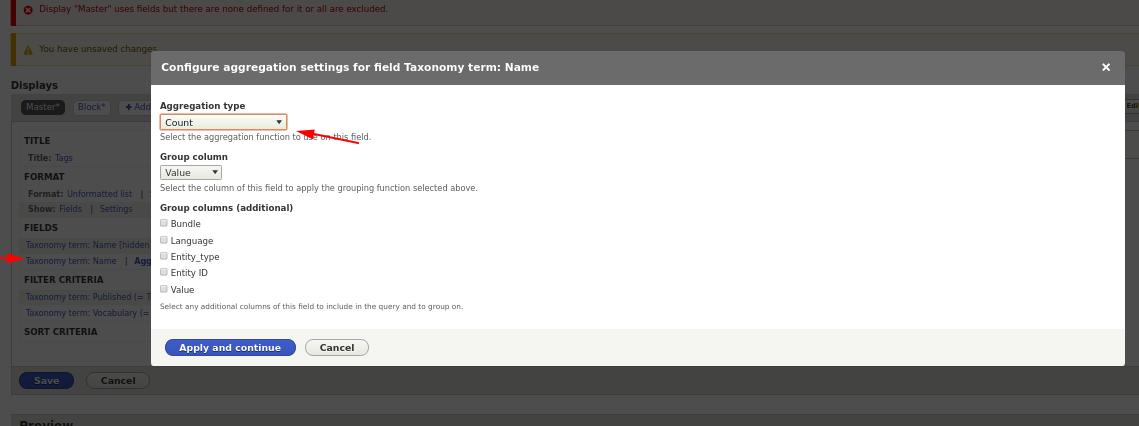
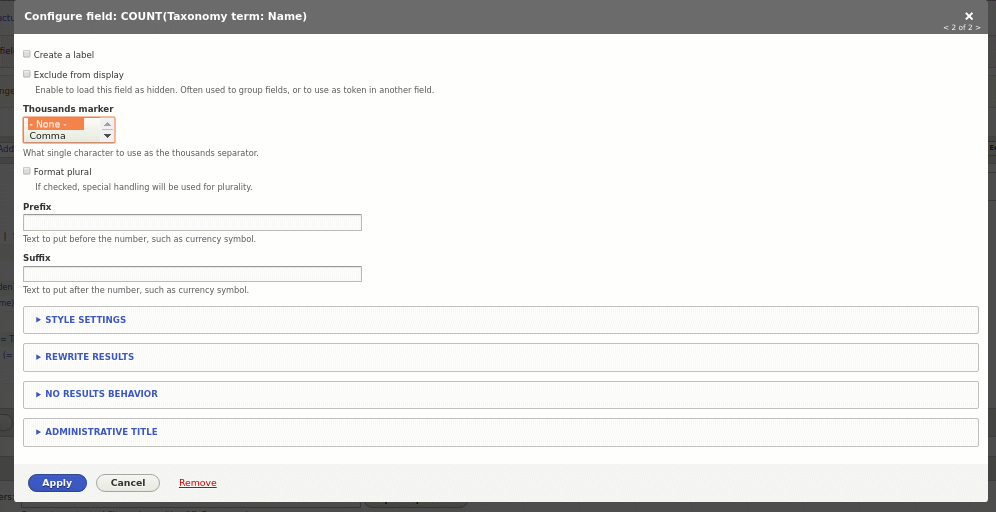
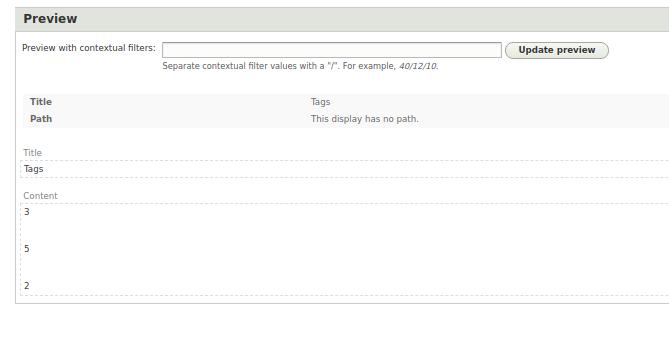
Now if you update the preview of the view, then you will already see a count of the amount of use of each of the term taxonomy:
Now it remains to append the tag name in front of each number. To do this, we use the second field, in which we display the first hidden field and in brackets the value of the second field. To do this, we will use the Overwrite Results setting:
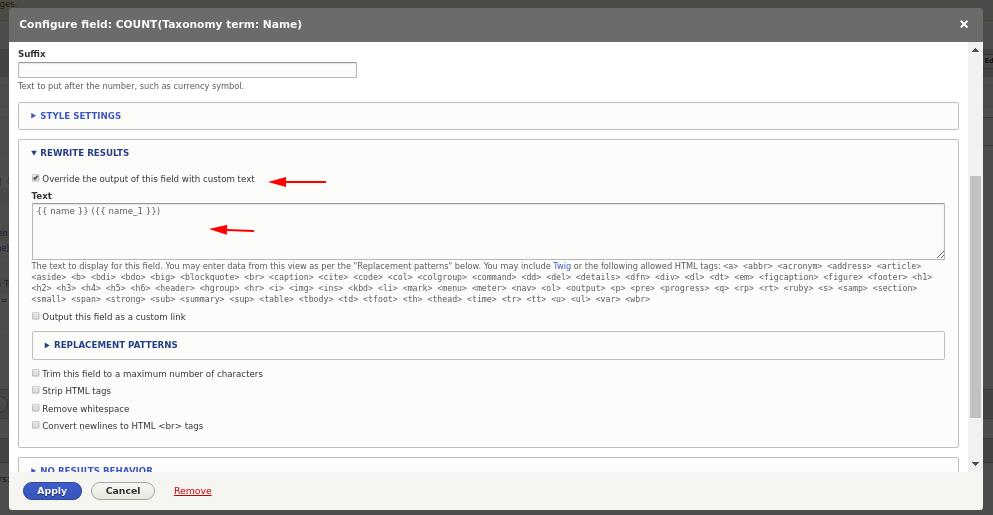
In the REPLACEMENT PATTERNS drop-down list, we can see which fields we can use when overwriting this field.
{{name}} ({{name_1}})
We write the second field in parentheses round so that our number is in brackets. Curly braces are taken from Twig, we will deal with it later, for now it is enough for us to know that if we use these values in {{}} they will be replaced by the values of the fields we need.
As a result, you should have these fields:

What should look like this:
